How to Understand and Track Your User’s Behavior
Behavioral analytics is an essential tool to keep track of your user’s movements on your website. It can be revealing when it comes to your website’s usability.
Day 5: Let’s stalk your website visitors (in a non-creepy way)
PS. This is a slightly longer, more technical article, just FYI 🙂
We’ve seen how knowing your numbers with Google Analytics can help you track user experience throughout your funnel.
But actually, numbers only give you a part of the picture.
To truly understand how users behave on your website, you need to follow their journey from when they land, to the moment they leave. And thanks to technology, you can.
Many platforms like Hotjar, Lucky Orange, CrazyEgg, Fullstory, VWO, allow you to basically “stalk” your website visitors, to see exactly what they pay attention to, where they click on and how they consume your content.
Cross reference this type of visual data with GA numbers, and you’ll have a sure-fire way for improving conversions.
We’ve been using Hotjar for all our projects, so we’ll use it for this example. But what you’ll learn here is applicable to any platform.
Hotjar allows you to track a few things on your site. Here’s what we’ll look at:
- Heatmaps, which are divided in:
- Click maps: showing you where users click
- Movement/attention maps: showing you where users move with their cursor
- Scroll maps: showing you how far down the page your visitors scroll
- User session recordings: screen recordings of real users using your site.
What insights can you gather from these tools? And how do you do it?
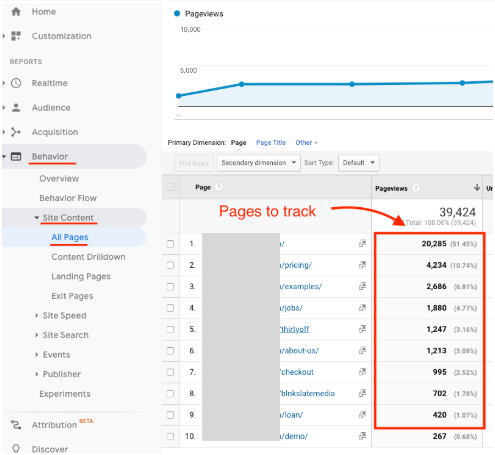
After you’ve installed Hotjar on your site, you’ll be able to create heatmaps for specific conversion pages. Our advice: use Google Analytics (Behavior – Site content – All pages) to decide which page gets the most traffic, and therefore which ones to test first, and create heatmaps for those.

Once your pages receive hit their required number of visits (2k, 10k etc.), you can check the heatmaps.
1. What should you look for in a Click Map?

- Do you get clicks on elements that aren’t clickable? Chances are they look clickable, so:
- Make those items clickable/add a link
- Redesign the element so it doesn’t look clickable
- Which links are the most clicked?
- Are people clicking on a different CTA to what you expected?
- Are there lots of clicks on the navigation menu, but not many for the actual page content? Users are probably struggling to find what they’re looking for.
- Do certain items get a lot of clicks, but they are further down the page? Move them up the page for more conversions, or check if important information has been hidden away.
2. What should you look for in a Movement Map?

- Is cursor activity spread all over the page with no specific focus areas? Create some attention points to make the page scannable (bullet lists, a summary, visual elements etc.)
- Is there dense mouse movement activity in certain areas? You have a powerful attention-drawing element on the page. Nice!
- Is there no activity at all in certain areas? You might be able to delete this content — it clearly isn’t working for the users.
3. What should you look for in a Scroll Map?

- Look for sudden changes in color. There can be a few reasons for this:
- People stop scrolling because they think they’ve reached the end of a page (“false bottom”)
- Your copy is driving people away
- Your main CTA is above the fold (the stuff you can see before you scroll) and it gets lots of clicks. This is a good sign — it means people like your page!
- Bigger, dark blue areas are places that users didn’t scroll to. These are problem areas and need to be addressed.
- Content might be boring or hard to read.
- Content is in the wrong place.
- The page is too long.
- There aren’t any CTAs.
4. What should you look for in User Session Recordings?

User recordings are super insightful, but can take away a lot of time. We recommend that you look at them only when you spot a specific problem (on Analytics and heatmaps first) that you want more information on.
Here’s what you should look for:
- Clicking
- Are people clicking on a link and using the back button right after? Either the page isn’t what they expected or the link copy was misleading.
- Are people clicking something repeatedly? It might be too small, or users probably think it’s supposed to be clickable. Look into it.
- Mouse movement
- Is their mouse moving between 2 points several times? Users may be unsure on what to do next.
- Do you see crazy mouse movements? They might be waiting for something to load, or a response on a Support chat.
- Are people highlighting or hovering over text? They might find it either important, unexpected or hard to understand.
- Page scrolling
- Are they scrolling the page continuously up and down? They probably can’t find what they need. A website poll could help here (“Did you find what you were looking for? Yes, No – Please specify”)
- Do people stop scrolling and suddenly leave? Users are probably bored.
Phew! We’re dizzy after writing all that. Hope you made it through unscathed.
The point is, you now have a checklist you can go through anytime you jump into Hotjar (or similar). These techniques could save you oodles of time and money, so it was worth delving into them properly.
Your homework:
Install Hotjar (or similar) on your site and create the following:
- Heatmaps for you main conversion pages (or at least the one you’ve picked as most important)
- User session recordings
Then think about a specific problem you’re trying to understand (preferably from Google Analytics) and use heatmaps and recordings to dig deeper.
